
Last Updated on July 6, 2026
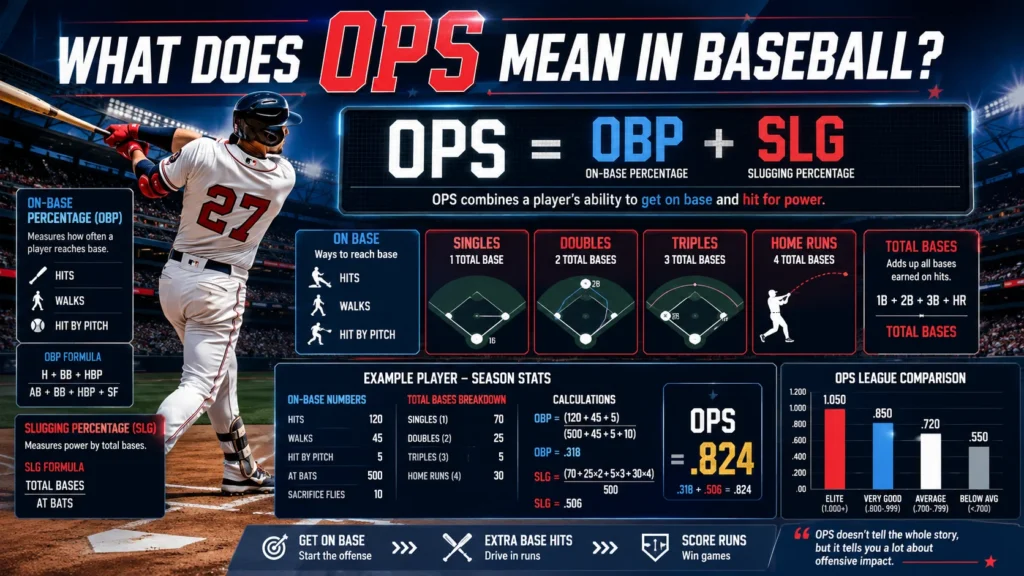
OPS in baseball stands for On-Base Plus Slugging. It measures a hitter’s overall offensive performance by adding On-Base Percentage (OBP) and Slugging Percentage (SLG). A higher OPS generally indicates a more productive hitter because it combines the ability to reach base with the ability to hit for power. In Major League Baseball, an OPS around .720 is typically league average, while .800 is considered good, .900 is excellent, and 1.000 or higher is elite.
Baseball has always been a numbers-driven sport. Fans don’t simply watch games. They analyze player performance, compare statistics, and debate who deserves recognition as the game’s best hitter.
Over the last few decades, advanced baseball analytics have changed how teams evaluate talent. While traditional statistics like batting average, home runs, and RBIs still matter, many coaches, scouts, analysts, and fans now rely on more complete offensive metrics.
One statistic appears almost everywhere today.
OPS.
If you’ve ever checked MLB player statistics, watched a baseball broadcast, or played fantasy baseball, you’ve probably noticed this number next to every hitter’s name.
But what does OPS mean in baseball, and why has it become one of the most widely used baseball hitting statistics?
The answer is surprisingly simple.
OPS combines two of the most important offensive skills:
- Getting on base consistently
- Hitting for power
Instead of looking at these abilities separately, OPS combines them into one easy-to-read statistic that gives a broader picture of offensive production.
That simplicity explains why broadcasters mention OPS during nearly every game and why baseball front offices continue using it as a quick evaluation tool.
This guide explains everything you need to know, including:
- The OPS baseball meaning
- What OPS stands for in baseball
- How the OPS formula works
- How to calculate OPS
- What qualifies as a good OPS
- League-average OPS in MLB
- OPS vs batting average
- OPS vs OBP
- OPS vs slugging percentage
- Why OPS matters in modern baseball analytics
- The strengths and weaknesses of the statistic
By the end, you’ll understand exactly why OPS has become one of baseball’s most trusted offensive statistics.
What Does OPS Mean in Baseball?
OPS stands for On-Base Plus Slugging.
It is an offensive statistic that measures how effective a hitter is by combining:
- On-Base Percentage (OBP)
- Slugging Percentage (SLG)
The formula looks simple.
OPS = OBP + SLG
Although the calculation is straightforward, the information it provides is incredibly valuable.
Instead of judging hitters by batting average alone, OPS evaluates two separate offensive skills that contribute directly to scoring runs.
What Does OPS Stand for in Baseball?
The abbreviation breaks down like this:
| Letter | Meaning | Measures |
| O | On | Reaching base |
| P | Plus | Adds two statistics together |
| S | Slugging | Power hitting |
Together, they create On-Base Plus Slugging, commonly shortened to OPS.
Every time a player reaches base through a hit or walk, they increase their on-base percentage.
Every time they hit doubles, triples, or home runs, they improve their slugging percentage.
OPS combines both numbers into one statistic.
Why Was OPS Created?
For decades, batting average dominated baseball conversations.
A player hitting .320 automatically looked like an elite hitter.
However, analysts discovered a major problem.
Batting average ignores several important offensive contributions.
For example, batting average doesn’t reward:
- Walks
- Hit-by-pitches
- Extra-base hits
- Overall offensive value
Imagine these two players.
| Player | Batting Average | Walks | Home Runs |
| Player A | .320 | 18 | 8 |
| Player B | .285 | 95 | 38 |
Traditional thinking often favored Player A because of the higher batting average.
Modern baseball analytics usually favor Player B.
Why?
Player B reaches base far more often and creates significantly more runs through extra-base hits.
OPS captures that difference almost immediately.
Why Is OPS So Popular?
OPS became popular because it balances two offensive abilities that every successful hitter needs.
Those abilities are:
- Getting on base
- Producing power
Think of offense like filling and emptying a gas tank.
Getting on base fills opportunities.
Power hitting turns those opportunities into runs.
A hitter who does both consistently becomes one of the league’s most valuable offensive players.
That’s exactly what OPS measures.
Baseball OPS Explained
OPS often appears complicated to new baseball fans.
Fortunately, understanding it takes only a few minutes.
The statistic combines two existing baseball metrics instead of creating an entirely new formula.
The First Half: On-Base Percentage (OBP)
On-base percentage measures how frequently a player reaches base.
Unlike batting average, OBP rewards hitters for more than just hits.
It includes:
- Singles
- Doubles
- Triples
- Home runs
- Walks
- Hit-by-pitches
Because getting on base creates scoring opportunities, teams value players with high OBPs.
Consider two hitters.
| Player | Hits | Walks | On-Base Percentage |
| Player A | 165 | 18 | .330 |
| Player B | 145 | 95 | .405 |
Player A collected more hits.
Player B reached base more frequently.
OBP recognizes that difference.
Why On-Base Percentage Matters
Every inning begins with one objective.
Get runners on base.
Without baserunners, even the strongest lineup struggles to score.
Players with excellent on-base percentages:
- Extend innings
- Increase pitch counts
- Create RBI opportunities
- Force pitchers into mistakes
Many baseball analysts consider reaching base the single most valuable offensive skill.
The Second Half: Slugging Percentage (SLG)
Slugging percentage measures hitting power.
Unlike batting average, slugging percentage gives different values to different hits.
Here’s how total bases work.
| Hit Type | Total Bases Awarded |
| Single | 1 |
| Double | 2 |
| Triple | 3 |
| Home Run | 4 |
A hitter who consistently drives doubles into the gap contributes far more offensive value than someone who hits only singles.
Slugging percentage reflects that difference.
Why Slugging Percentage Matters
Power changes games quickly.
One swing can:
- Clear the bases
- Break a tie
- End a pitcher’s dominance
- Shift momentum
That’s why teams prioritize players with high slugging percentages.
Power hitters often produce:
- More extra-base hits
- More total bases
- More home runs
- More runs batted in
Slugging percentage captures all of those contributions.
How OPS Combines Both Skills
Imagine two hitters.
| Player | OBP | SLG | OPS |
| Player A | .410 | .540 | .950 |
| Player B | .305 | .640 | .945 |
Player A reaches base constantly.
Player B relies more heavily on power.
Both players produce nearly identical OPS values because they contribute offensively in different ways.
That flexibility makes OPS an effective all-around statistic.
Why Baseball Analytics Embraced OPS
Before advanced baseball metrics became mainstream, teams often evaluated hitters using isolated statistics.
Today, organizations want broader offensive evaluations.
OPS provides exactly that.
It rewards players who:
- Reach base consistently
- Hit for power
- Produce runs
- Contribute across multiple offensive categories
Although newer statistics like wOBA and OPS+ provide even deeper analysis, OPS remains one of the easiest and most useful offensive metrics for fans to understand.
“OPS doesn’t tell the whole story, but it tells a much bigger story than batting average ever could.”
How Is OPS Calculated?
One reason OPS became so popular is its simplicity.
Unlike some advanced baseball metrics that require complex formulas and league adjustments, OPS uses only two existing statistics.
If you know a player’s on-base percentage and slugging percentage, you can calculate OPS in seconds.
OPS Formula in Baseball
The official formula is:
OPS = On-Base Percentage (OBP) + Slugging Percentage (SLG)
That’s it.
No complicated calculations.
No hidden variables.
Simply add the two values together.
Understanding the Formula
Before calculating OPS, you first need the player’s:
- On-Base Percentage (OBP)
- Slugging Percentage (SLG)
For example:
| Statistic | Value |
| OBP | .372 |
| SLG | .518 |
Now perform the calculation.
OPS = .372 + .518
OPS = .890
The player’s OPS is:
.890
That single number tells you the player reaches base often and hits for above-average power.
Step-by-Step OPS Calculation Example
Let’s walk through a complete example.
Suppose a player finishes the season with:
| Statistic | Total |
| On-Base Percentage | .391 |
| Slugging Percentage | .564 |
Now calculate the OPS.
.391 + .564 = .955
Final OPS:
.955
An OPS near .955 represents outstanding offensive production and typically ranks among the best hitters over a full season.
Why the Formula Works
OPS succeeds because it balances two complementary skills.
A player who reaches base but rarely hits for power can still produce a respectable OPS.
Likewise, a power hitter who gets on base at a strong rate can achieve an elite OPS.
Instead of focusing on one offensive trait, the formula rewards hitters who contribute in multiple ways.
How Are On-Base Percentage and Slugging Percentage Calculated?
Understanding the OPS formula in baseball becomes much easier once you know where its two components come from. While most fans only see a player’s OPS on a scoreboard or stat page, that number begins with two separate calculations.
One measures how often a player reaches base. The other measures how much damage they do when they make contact.
Together, they paint a much clearer picture of offensive production than batting average alone.
How On-Base Percentage (OBP) Is Calculated
On-base percentage measures how frequently a hitter reaches base through legitimate offensive actions.
Unlike batting average, OBP doesn’t limit itself to hits. It also rewards plate discipline, which is one reason modern baseball analytics value it so highly.
The official formula is:
OBP = (Hits + Walks + Hit By Pitch) ÷ (At-Bats + Walks + Hit By Pitch + Sacrifice Flies)
This calculation counts every successful trip to first base except those caused by errors or fielder’s choices.
For example, imagine a player finishes a stretch of games with:
| Statistic | Total |
| Hits | 42 |
| Walks | 18 |
| Hit By Pitch | 3 |
| At-Bats | 120 |
| Sacrifice Flies | 2 |
The calculation becomes:
(42 + 18 + 3) ÷ (120 + 18 + 3 + 2)
63 ÷ 143 = .441
An OBP of .441 means the player reaches base in nearly 44% of plate appearances.
That level of consistency puts constant pressure on opposing pitchers and creates more scoring opportunities.
Why Walks Matter
Many new fans underestimate walks because they don’t count as hits.
Teams don’t make that mistake.
A walk:
- Extends an inning
- Increases pitch counts
- Creates baserunners
- Improves run-scoring opportunities
- Forces pitchers into stressful situations
That’s why patient hitters often post excellent OBPs even if they don’t lead the league in batting average.
How Slugging Percentage (SLG) Is Calculated
Slugging percentage measures hitting power rather than simply rewarding contact.
Instead of treating every hit equally, SLG assigns a different value to each type of hit.
| Hit Type | Total Bases |
| Single | 1 |
| Double | 2 |
| Triple | 3 |
| Home Run | 4 |
The formula is:
Slugging Percentage = Total Bases ÷ At-Bats
Suppose a player records:
- 70 singles
- 32 doubles
- 6 triples
- 28 home runs
Their total bases would be:
70 + (32×2) + (6×3) + (28×4)
70 + 64 + 18 + 112
264 Total Bases
If they had 510 at-bats:
264 ÷ 510 = .518
Their slugging percentage is .518.
Why Total Bases Matter
Two hitters can collect the same number of hits while producing dramatically different offensive value.
Consider this example.
| Player | Hits | Home Runs | Doubles | SLG |
| Player A | 160 | 12 | 22 | .410 |
| Player B | 160 | 38 | 36 | .595 |
Both players have identical hit totals.
Player B generates significantly more extra-base hits, more total bases, and more run production.
Slugging percentage captures that difference immediately.
Putting OBP and SLG Together
Now combine both statistics.
| OBP | SLG | OPS |
| .388 | .547 | .935 |
An OPS of .935 tells you the hitter combines patience, consistency, and power into one complete offensive profile.
That’s exactly why OPS has become one of the most recognizable baseball metrics.
What Is a Good OPS in Baseball?
One of the most common questions fans ask is:
What is a good OPS in baseball?
The answer depends on league averages and offensive environments, but there are widely accepted benchmarks that make evaluating hitters much easier.
Generally speaking, the higher the OPS, the more productive the hitter.
General OPS Scale
The following table provides a practical way to interpret OPS.
| OPS | Rating | Offensive Level |
| Below .600 | Poor | Limited offensive production |
| .600–.699 | Below Average | Needs improvement |
| .700–.749 | Average | Solid everyday hitter |
| .750–.799 | Above Average | Valuable offensive contributor |
| .800–.899 | Very Good | Strong middle-of-the-order bat |
| .900–.999 | Excellent | All-Star caliber production |
| 1.000+ | Elite | MVP-level offensive performance |
These ranges aren’t official MLB classifications, but analysts and broadcasters commonly use them when discussing player performance.
Why .800 OPS Is Often the Goal
Crossing the .800 mark usually means a hitter contributes in multiple ways.
Players with an OPS above .800 often:
- Reach base consistently
- Hit plenty of doubles
- Produce home runs
- Drive in runs
- Score frequently
- Maintain strong offensive efficiency
Teams value these hitters because they create offense without relying on one specific skill.
What Is an Elite OPS?
An OPS above 1.000 is rare over a full MLB season.
Players who reach that level usually dominate nearly every offensive category.
Elite hitters typically combine:
- Outstanding plate discipline
- Exceptional bat speed
- High contact quality
- Significant home-run power
- Consistent extra-base hitting
Only a handful of players achieve this level during any given season.
Why Position Matters
Not every position demands the same offensive production.
For example:
| Position | Expected OPS |
| Catcher | Lower |
| Shortstop | Moderate |
| Center Field | Moderate |
| First Base | Higher |
| Designated Hitter | Highest |
A catcher posting a .760 OPS may rank among the better offensive catchers in baseball.
A designated hitter with the same OPS might be viewed as below expectations.
Context always matters.
What Is the Average OPS in MLB?
OPS changes from season to season.
Rule changes, pitching quality, ballpark conditions, and offensive trends all influence league-wide production.
In recent Major League Baseball seasons, league-average OPS has generally fallen between:
| Level | OPS |
| MLB Average | Around .720 |
| Above Average | Around .780 |
| Excellent | Around .900 |
| Elite | 1.000+ |
These numbers provide useful context when comparing players.
Why League Average Changes
Baseball constantly evolves.
Several factors influence league-average OPS.
Pitching Quality Improves
Modern pitchers throw harder than ever.
Many relief pitchers consistently reach:
- 98 mph
- 100 mph
- 102 mph
Harder throwing generally reduces offensive production.
Defensive Positioning
Although recent rule changes have limited defensive shifts, teams still rely heavily on advanced positioning.
Better defense reduces batting results on balls in play.
Ballpark Differences
Some stadiums favor hitters.
Others strongly favor pitchers.
For example, altitude, wind patterns, and outfield dimensions all influence slugging percentage.
Why Comparing Eras Can Be Misleading
A .900 OPS today isn’t identical to a .900 OPS from decades ago.
Different eras featured:
- Different baseballs
- Different strike zones
- Different pitching strategies
- Different offensive environments
That’s one reason analysts often use OPS+, which adjusts for league averages and ballpark effects.
We’ll discuss OPS+ later in this guide.
OPS vs Batting Average
Many casual fans still judge hitters by batting average.
While batting average remains useful, it tells only part of the story.
OPS provides a much broader evaluation.
Batting Average Measures One Thing
Batting average answers a simple question.
How often does a player get a hit?
It ignores:
- Walks
- Hit-by-pitches
- Power
- Total bases
- Offensive efficiency
OPS Measures Two Skills
OPS rewards hitters for:
- Reaching base
- Hitting for power
Because of that, two players with identical batting averages can have dramatically different offensive value.
Consider this comparison.
| Statistic | Player A | Player B |
| Batting Average | .300 | .300 |
| Walks | 24 | 92 |
| Home Runs | 10 | 36 |
| OBP | .332 | .409 |
| SLG | .401 | .601 |
| OPS | .733 | 1.010 |
Both players hit .300.
Player B contributes far more offense.
OPS reveals that difference instantly.
Why Teams Prefer OPS
Teams score runs by:
- Getting runners on base
- Driving them home
OPS directly measures both.
Batting average measures only one piece of that equation.
OPS vs On-Base Percentage (OBP)
Some analysts argue that OBP deserves even more attention than OPS.
They’re not entirely wrong.
What OBP Measures Better
OBP focuses exclusively on reaching base.
Every baserunner increases scoring opportunities.
Because of that, many front offices place tremendous value on hitters with elite OBPs.
What OPS Adds
OPS expands the picture.
Instead of stopping at reaching base, it also rewards hitters who:
- Hit doubles
- Hit triples
- Hit home runs
- Generate total bases
The result is a more balanced offensive evaluation.
Which Is Better?
Neither statistic completely replaces the other.
| OBP | OPS |
| Measures reaching base | Measures reaching base and power |
| Rewards patience | Rewards patience and power |
| Excellent for evaluating table setters | Better for evaluating complete hitters |
Most analysts consider both statistics together.
OPS vs Slugging Percentage (SLG)
Slugging percentage focuses entirely on power.
OPS gives that power additional context.
What SLG Measures
Slugging rewards:
- Doubles
- Triples
- Home runs
- Total bases
It ignores how often players actually reach base.
Example
Imagine two hitters.
| Player | SLG | OBP | OPS |
| Player A | .590 | .295 | .885 |
| Player B | .520 | .410 | .930 |
Player A has more raw power.
Player B reaches base far more often.
OPS recognizes that Player B contributes more complete offense overall.
Why OPS Is More Balanced
Power alone doesn’t win games.
Neither does patience alone.
Teams need hitters who can:
- Reach base
- Extend innings
- Produce extra-base hits
- Score runs
- Drive in teammates
OPS rewards all of those offensive contributions, making it one of the most useful all-around hitting statistics in baseball.
Why Is OPS Important in Baseball?
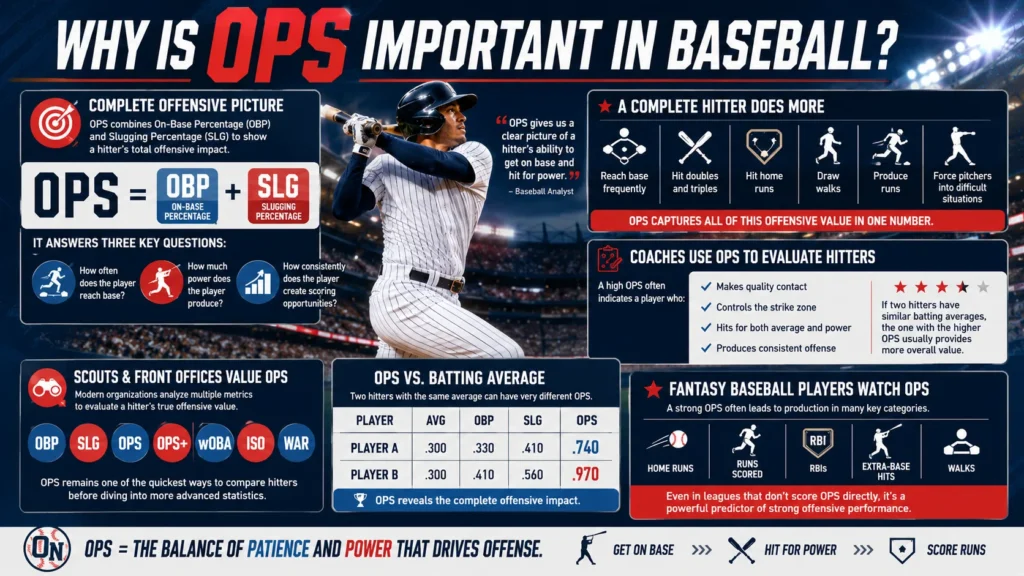
OPS has become one of the most trusted baseball offensive statistics because it summarizes a hitter’s overall offensive contribution in a single number. While no statistic tells the entire story, OPS provides a quick snapshot of how dangerous a player is at the plate.
Years ago, many fans judged hitters almost entirely by batting average. Today, teams use far more advanced methods. They still consider batting average, but they also want to know:
- How often does the player reach base?
- How much power does the player produce?
- How consistently does the player create scoring opportunities?
OPS helps answer all three questions.
OPS Measures Complete Offensive Production
A complete hitter does more than collect singles.
The best offensive players usually:
- Reach base frequently
- Hit doubles and triples
- Hit home runs
- Draw walks
- Produce runs
- Force pitchers into difficult situations
OPS captures much of that offensive value without requiring multiple separate statistics.
Coaches Use OPS to Evaluate Hitters
Managers and coaches don’t rely on OPS alone, but they use it as a valuable starting point.
A high OPS often indicates that a player:
- Makes quality contact
- Controls the strike zone
- Hits for both average and power
- Produces consistent offense
If two hitters have similar batting averages, the one with the higher OPS usually contributes more overall value.
Scouts and Front Offices Value OPS
Modern baseball organizations invest heavily in analytics.
During player evaluation, decision-makers examine:
- OBP
- SLG
- OPS
- OPS+
- wOBA
- ISO
- WAR
OPS remains one of the quickest ways to compare hitters before diving into more advanced statistics.
Fantasy Baseball Players Watch OPS
Fantasy baseball managers often monitor OPS because it reflects overall hitting quality.
Players with strong OPS numbers frequently contribute across multiple offensive categories, including:
- Home runs
- Runs scored
- RBIs
- Extra-base hits
- Walks
Even in leagues that don’t score OPS directly, it often predicts strong offensive performance throughout the season.
Strengths of OPS
OPS became popular for good reason.
It combines simplicity with meaningful insight, making it useful for casual fans and experienced analysts alike.
Easy to Understand
One of OPS’s biggest strengths is its simplicity.
Instead of studying several offensive statistics, fans can glance at one number and quickly estimate a hitter’s effectiveness.
Combines Two Critical Skills
Unlike batting average, OPS rewards both:
- Getting on base
- Hitting for power
Those two abilities drive offensive success.
Better Than Batting Average Alone
Batting average ignores many valuable offensive events.
OPS rewards:
- Walks
- Doubles
- Triples
- Home runs
- Total offensive production
That makes it a much more complete statistic.
Useful Across Different Player Types
OPS doesn’t favor only one style of hitter.
It rewards:
- Contact hitters with excellent plate discipline
- Power hitters with strong slugging percentages
- Complete hitters who excel at both
Because of this balance, OPS works well for comparing players with different offensive approaches.
Limitations of OPS
Despite its popularity, OPS isn’t perfect.
Every baseball statistic has weaknesses, and OPS is no exception.
Understanding those limitations helps you interpret the number more accurately.
OBP and SLG Are Weighted Equally
OPS simply adds OBP and SLG together.
However, research in baseball analytics has shown that reaching base generally contributes slightly more to run scoring than slugging percentage.
Because OPS gives equal weight to both statistics, it doesn’t perfectly reflect offensive value.
It Ignores Baserunning
OPS measures hitting only.
It doesn’t account for:
- Stolen bases
- Taking extra bases
- Baserunning intelligence
- Speed
A fast player who consistently creates runs with aggressive baserunning receives no extra credit in OPS.
It Doesn’t Measure Defense
OPS evaluates offense exclusively.
Outstanding defenders may have average OPS values while still providing tremendous overall value to their teams.
Ballparks Affect OPS
Some stadiums naturally produce more offense.
Others strongly favor pitchers.
A hitter playing in a hitter-friendly ballpark may post a higher OPS than an equally talented player in a pitcher-friendly stadium.
This is one reason analysts often use OPS+, which adjusts for ballpark effects.
What Is OPS+ in Baseball?
As baseball analytics evolved, statisticians developed a better way to compare hitters across different seasons and ballparks.
That statistic is OPS+.
What Does OPS+ Measure?
OPS+ starts with a player’s OPS.
It then adjusts the number for:
- League-average offense
- Ballpark factors
- Seasonal scoring environment
The result allows fairer comparisons between players from different teams and eras.
How to Read OPS+
OPS+ uses 100 as league average.
Here’s the general scale.
| OPS+ | Meaning |
| Below 100 | Below league average |
| 100 | League average |
| 110 | 10% better than league average |
| 125 | 25% better than league average |
| 150 | Elite offensive season |
| 170+ | Historically great hitter |
For example:
- A player with an OPS+ of 140 performed 40% better than the league-average hitter after adjusting for external factors.
Why Analysts Prefer OPS+
Suppose two players finish with identical OPS numbers.
One plays in a stadium where home runs are common.
The other plays in a park known for suppressing offense.
OPS treats them equally.
OPS+ adjusts for those differences, making comparisons more meaningful.
OPS Compared to Other Advanced Baseball Metrics
OPS is excellent, but it isn’t the only offensive statistic used today.
Several advanced metrics provide even deeper insight into player performance.
OPS vs Weighted On-Base Average (wOBA)
Weighted On-Base Average, commonly called wOBA, assigns different values to offensive events based on how much they contribute to scoring runs.
Unlike OPS, wOBA doesn’t treat every component equally.
For example:
- A home run contributes more than a single.
- A walk contributes less than a double.
- Every offensive event receives a carefully calculated weight.
Many analysts consider wOBA one of the best offensive statistics available.
OPS vs Isolated Power (ISO)
ISO measures only a hitter’s raw power.
Instead of rewarding singles, it focuses on extra-base hits.
High ISO usually indicates:
- Frequent doubles
- Plenty of home runs
- Strong slugging ability
Unlike OPS, ISO says nothing about reaching base.
OPS vs WAR
Wins Above Replacement (WAR) is much broader.
WAR attempts to estimate a player’s total contribution by including:
- Hitting
- Defense
- Baserunning
- Position
- Playing time
OPS evaluates offense only.
WAR evaluates the complete player.
Comparison Table
| Statistic | Measures | Includes Defense | Includes Baserunning |
| Batting Average | Hits | No | No |
| OBP | Reaching base | No | No |
| SLG | Power | No | No |
| OPS | On-base ability + power | No | No |
| OPS+ | OPS adjusted for league and park | No | No |
| wOBA | Weighted offensive value | No | No |
| ISO | Pure power | No | No |
| WAR | Overall player value | Yes | Yes |
Each statistic serves a different purpose.
Together, they provide a complete picture of player performance.
How MLB Teams Use OPS
Professional baseball organizations rely on far more than traditional statistics when evaluating players.
OPS has become one of the foundational numbers used throughout the game.
Building Lineups
Managers often use OPS when deciding where hitters should bat in the lineup.
Players with higher OPS values frequently occupy premium offensive spots because they are more likely to:
- Reach base
- Drive in runs
- Hit for extra bases
- Produce consistent offense
Player Development
Minor league coaches monitor OPS to track a prospect’s offensive growth.
Improving OPS often indicates progress in areas such as:
- Plate discipline
- Contact quality
- Power development
- Strike-zone awareness
Trade and Free-Agent Evaluations
When teams explore trades or free-agent signings, OPS provides a quick snapshot of offensive ability.
Decision-makers then combine OPS with scouting reports and advanced analytics before making final decisions.
Common Misconceptions About OPS
Although OPS is straightforward, several misconceptions continue to circulate among baseball fans.
“OPS Is Just Batting Average”
This is false.
Batting average measures only hits.
OPS combines:
- On-base percentage
- Slugging percentage
The two statistics measure very different aspects of offense.
“A High Batting Average Guarantees a High OPS”
Not always.
A hitter can bat .320 while rarely walking or hitting for power.
Meanwhile, another hitter may bat .270 but post a much higher OPS thanks to:
- Frequent walks
- Home runs
- Doubles
- Strong slugging percentage
“OPS Measures Everything”
It doesn’t.
OPS ignores:
- Defense
- Speed
- Baserunning
- Situational hitting
- Leadership
- Pitch framing
- Positional value
It is an outstanding offensive statistic, but it isn’t a complete evaluation of a player’s overall contribution.
Frequently Asked Questions
What does OPS mean in baseball?
OPS stands for On-Base Plus Slugging. It combines On-Base Percentage (OBP) and Slugging Percentage (SLG) into one statistic that measures a hitter’s overall offensive performance.
What is a good OPS in baseball?
Generally:
| OPS | Quality |
| .700 | Average |
| .800 | Good |
| .900 | Excellent |
| 1.000+ | Elite |
League averages change slightly from season to season, but these benchmarks remain useful.
How is OPS calculated?
The formula is simple.
OPS = OBP + SLG
Add a player’s on-base percentage and slugging percentage to calculate their OPS.
Why is OPS better than batting average?
Batting average measures only how often a player records a hit.
OPS also rewards:
- Walks
- Extra-base hits
- Overall offensive production
Because of that, OPS provides a more complete picture of hitting performance.
Is OPS an advanced baseball statistic?
OPS sits between traditional and advanced metrics.
It uses two traditional statistics but has become one of the foundations of modern baseball analytics.
More advanced metrics, such as wOBA and WAR, build on similar ideas while incorporating additional context.
Does OPS include walks?
Yes.
Walks improve On-Base Percentage (OBP), which is one half of the OPS formula.
What is the highest possible OPS?
There is no fixed maximum.
Because slugging percentage can exceed 1.000, OPS can also exceed 2.000 in extremely small sample sizes.
Over a full MLB season, however, an OPS above 1.000 is exceptionally rare and represents elite offensive production.
Conclusion
So, what does OPS mean in baseball?
OPS stands for On-Base Plus Slugging, a statistic that combines On-Base Percentage (OBP) and Slugging Percentage (SLG) to evaluate a hitter’s overall offensive performance. By measuring both the ability to reach base and the ability to hit for power, OPS provides a far more complete picture than batting average alone.
Its straightforward formula makes it easy to understand, yet it delivers meaningful insight into a player’s offensive value. Whether you’re comparing everyday starters, evaluating prospects, following the MLB OPS leaderboard, or managing a fantasy baseball team, OPS offers a reliable starting point for assessing hitting performance.
While advanced metrics such as OPS+, wOBA, ISO, and WAR provide additional context, OPS remains one of the most practical and widely recognized statistics in baseball. It balances simplicity with usefulness, making it valuable for newcomers and experienced fans alike.
The next time you see a player’s OPS on a scoreboard or stat page, you’ll know exactly what it represents. More importantly, you’ll understand why teams, analysts, broadcasters, and fans continue to rely on it as one of the game’s most important measures of offensive success.

Sophia Bennett is a professional writer focused on explaining word meanings, expressions and everyday language in a simple and engaging way.